
We are growth engineers, transforming businesses with data-led strategies



















WHAT YOU GET
Every project we do ends in one of two places: more revenue, or less waste
Growth problems are different for every company, but underneath they come down to the same handful of levers. We find the ones that will move for you.
Increase revenue
Revenue uplift
- Retention
- Acquisition
- New markets
- ATV
- Frequency
- Pricing
- Ancillary revenue
- New channels
- NPD and innovation
Increase efficiency
Do more with less
- Investment allocation
- KPI design and measurement
- Test, measure, learn, design
- GTM benchmarking
HOW WE HELP
We generally answer 3 key questions, and have 9 ways to answer them.
Insight & Growth Diagnostics
Complex market dynamics turned into a clear diagnosis, scenario views and a prioritised opportunity map.
Strategy Design
Business and marketing strategy that's commercially focused and agreed across the leadership team.
KPI & Performance Optimisation
Measurement your leadership agrees on, dashboards built for decisions, and advice on what to change.
Futurecasting & Scenario Modelling
Clear scenarios for what's coming, including the cost of doing nothing, so leadership can commit with confidence.
Investable GTM Solutions
Marketing-led share and revenue growth programmes, each with a business case a CFO can sign.
AI Search Strategy
Find out what AI tells your customers about your brand, and what the whole business should do about it.
Market & Audience Segmentation
Find, size and understand the consumer and B2B segments worth winning, and keeping.
Competitive Innovation
Find the moves your competitors haven't made yet, and make them first.
Marketing Investment Efficiency
Frameworks and benchmarks that put each pound of marketing budget where it earns most.
OUR WORK
Some examples of growth engineering in action.
-
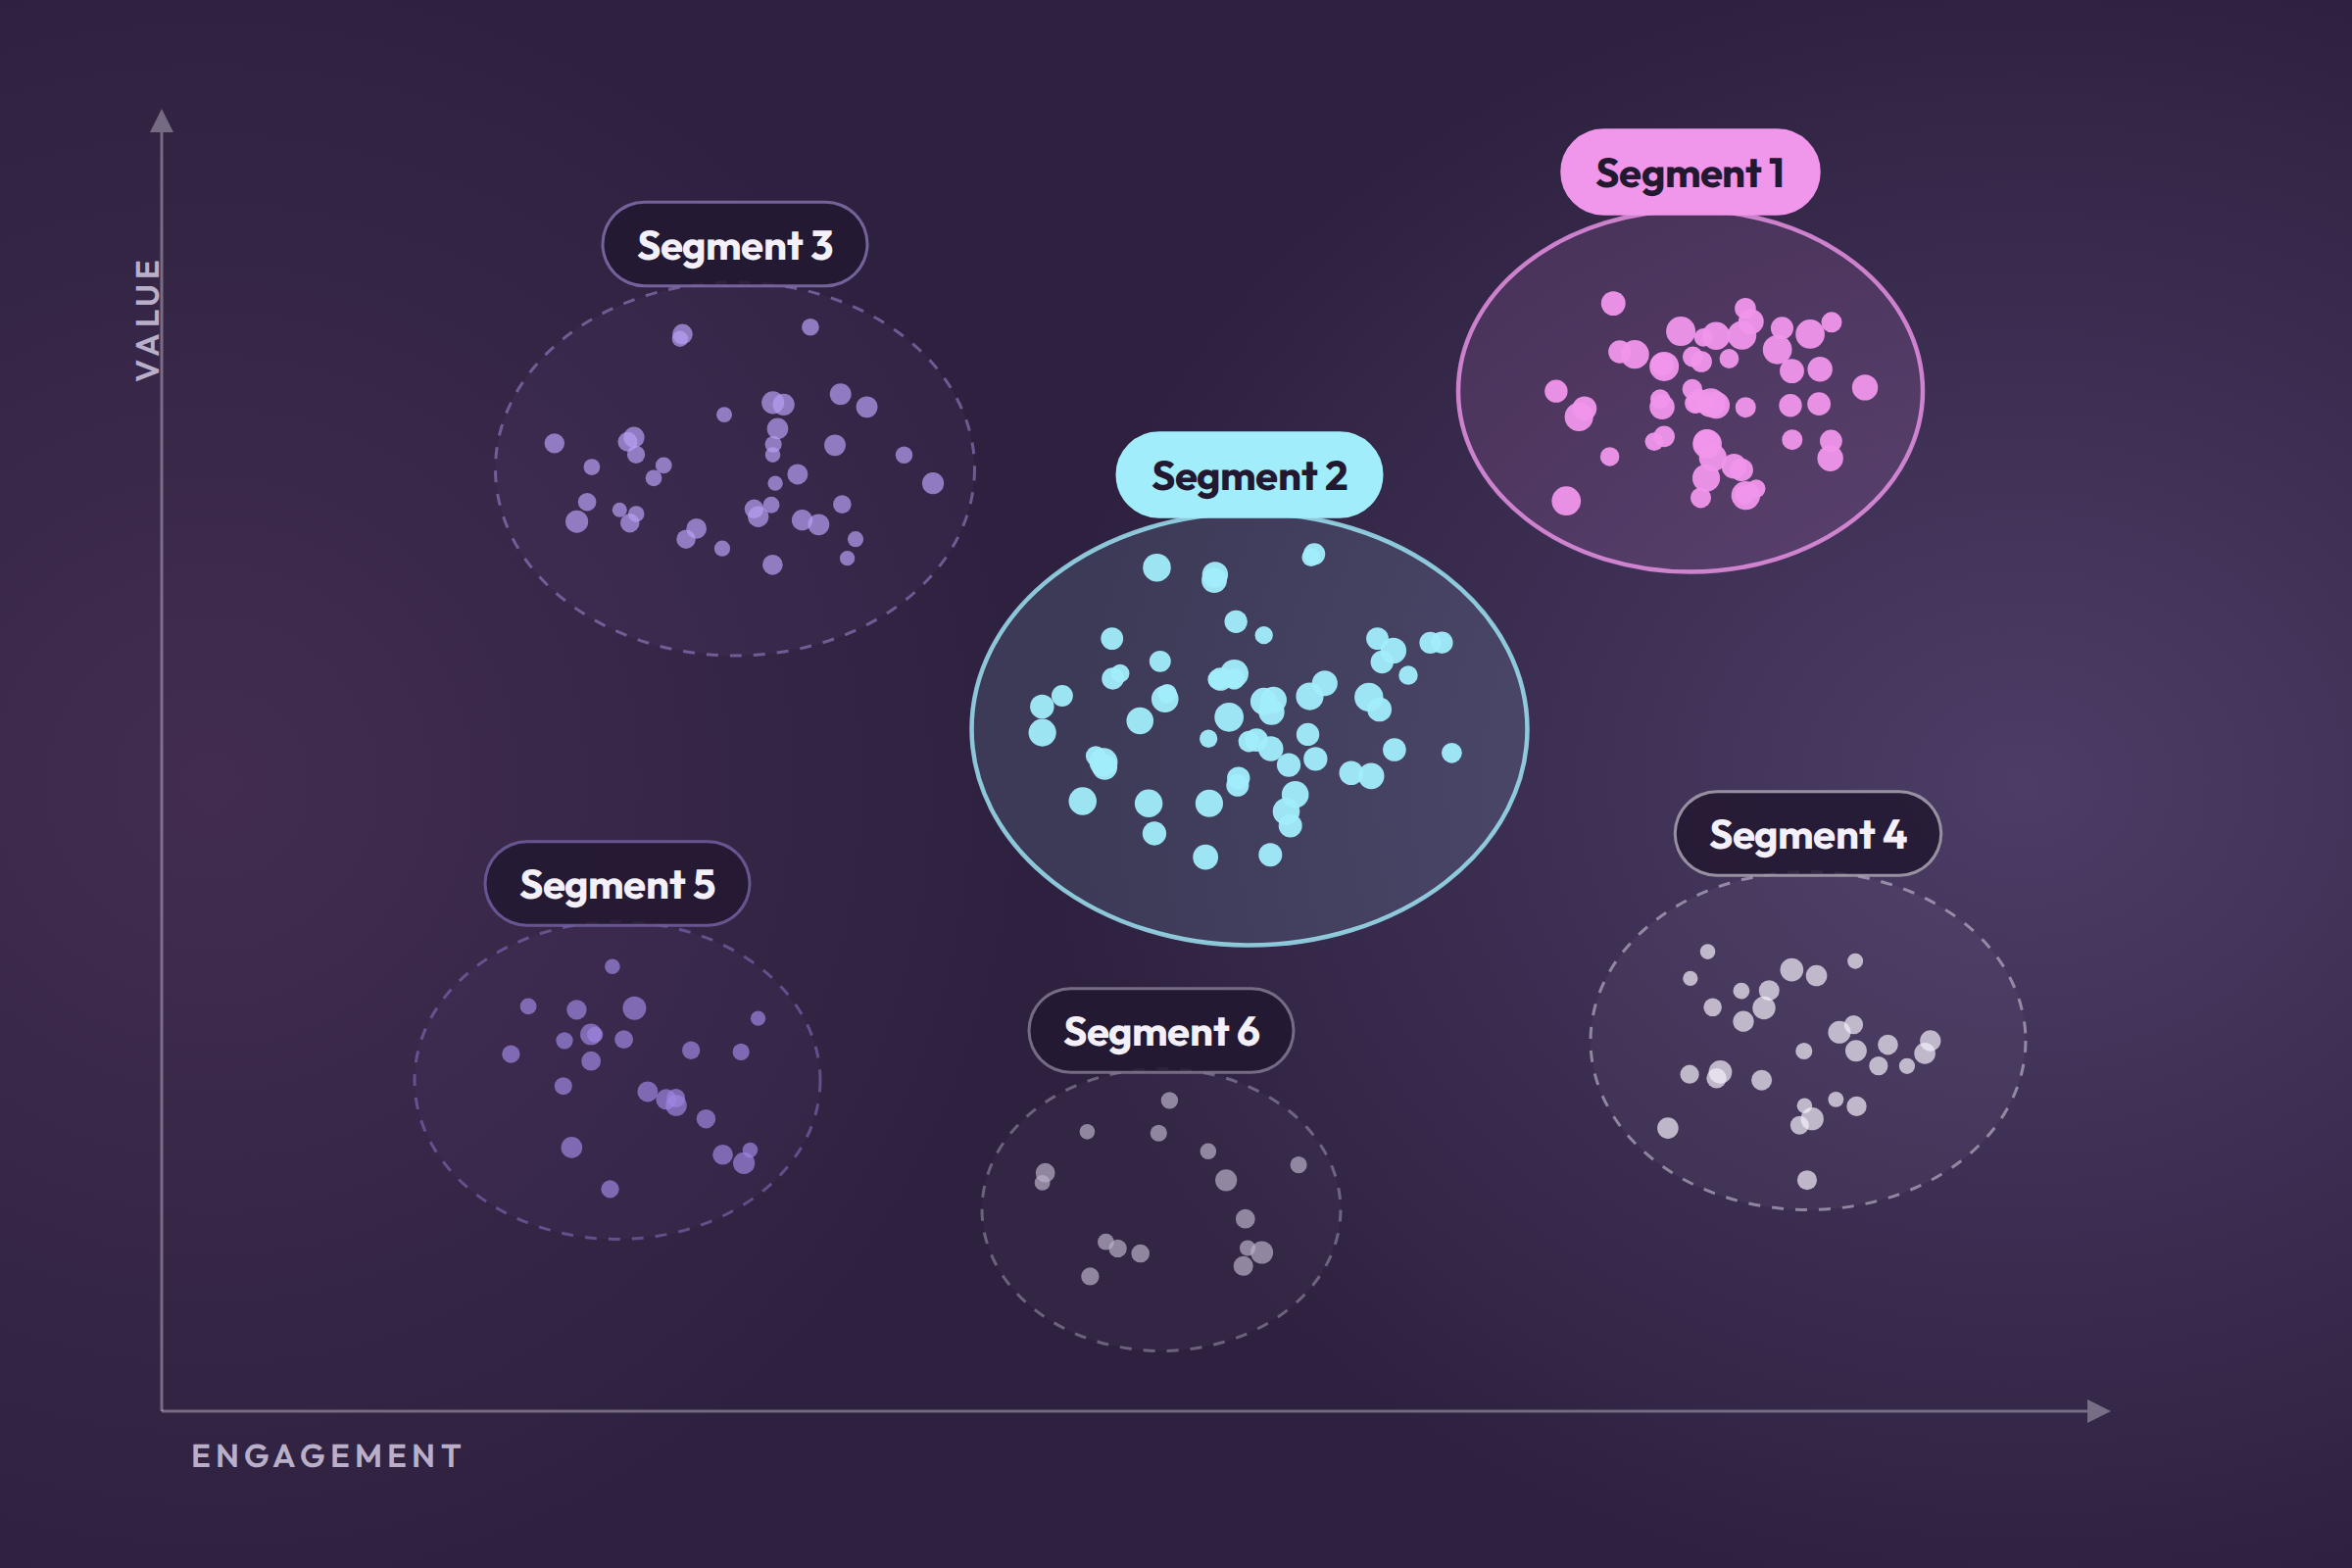
Global market segmentation
A major international art brand led its category, but competitors were catching up while total art spend stayed flat. We built a revenue-first segmentation of the world's high-net-worth art buyers and show where the next five years of growth would come from.
-
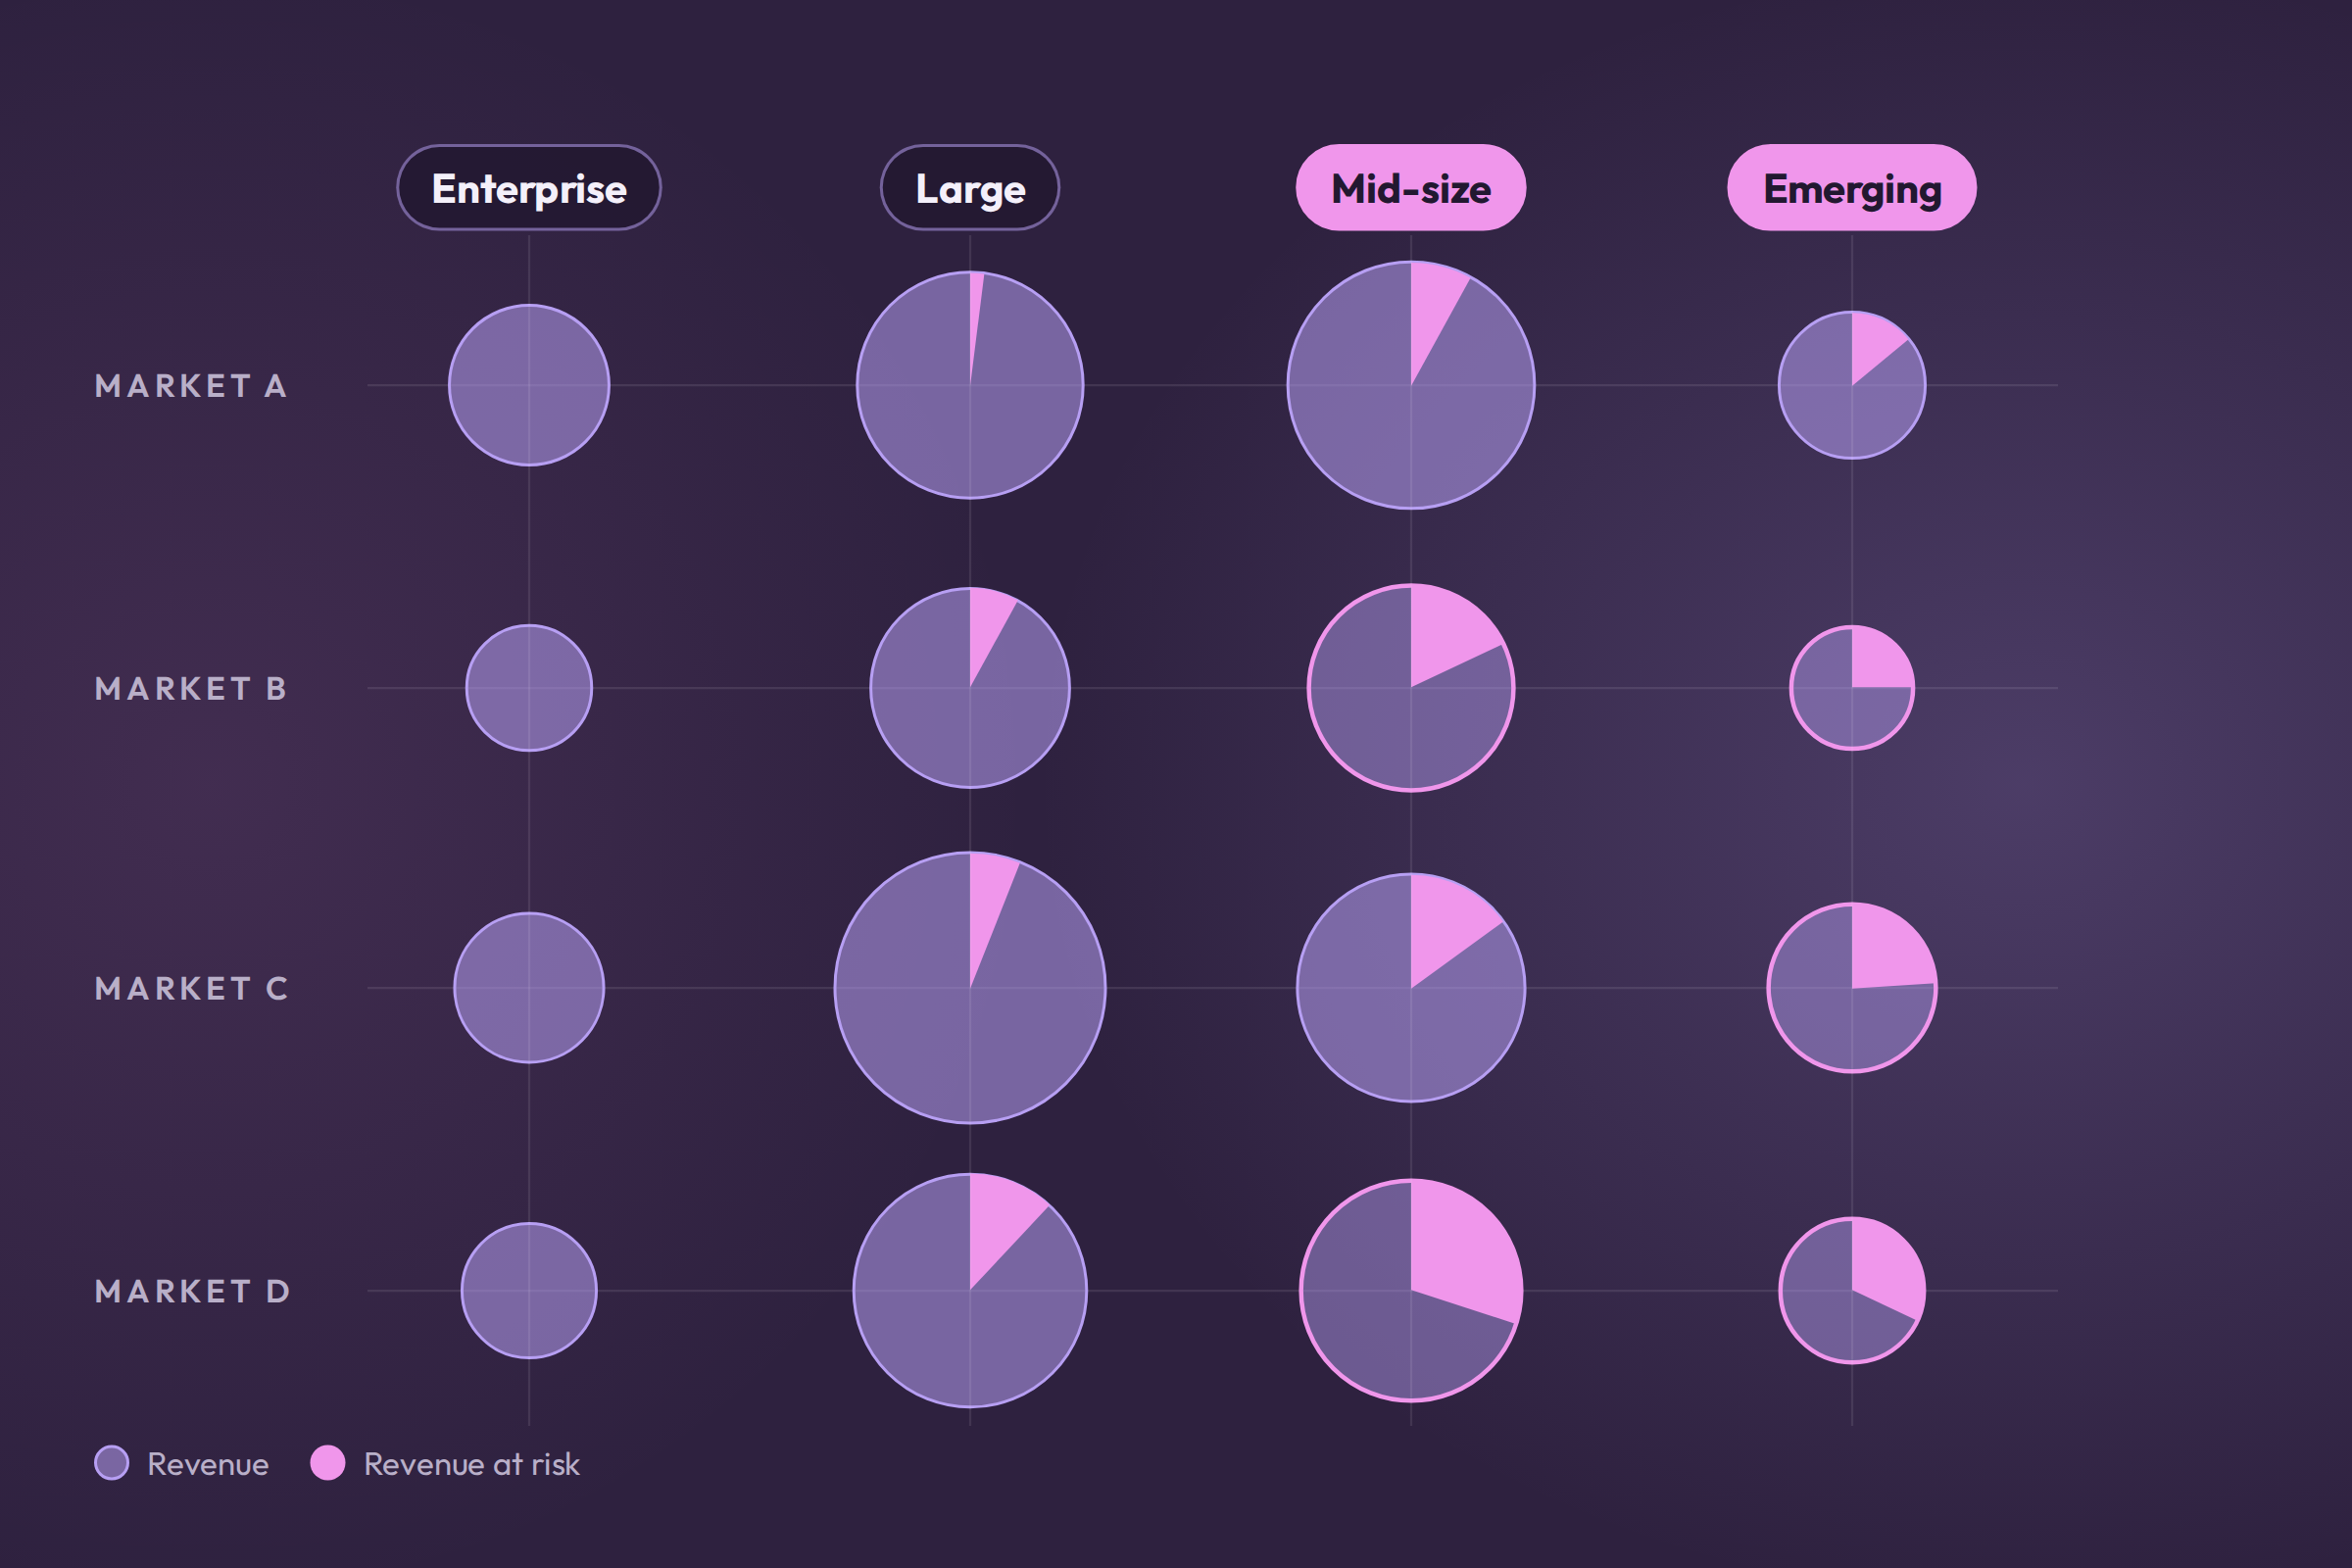
Executive client research
A global B2B brand needed hard evidence on how the clients behind most of its revenue really felt, just as many were seeing business fall and costs rise. We surveyed 76 senior leaders across four client tiers, then built a revenue-risk model and eight recommendations to protect its core income.
-
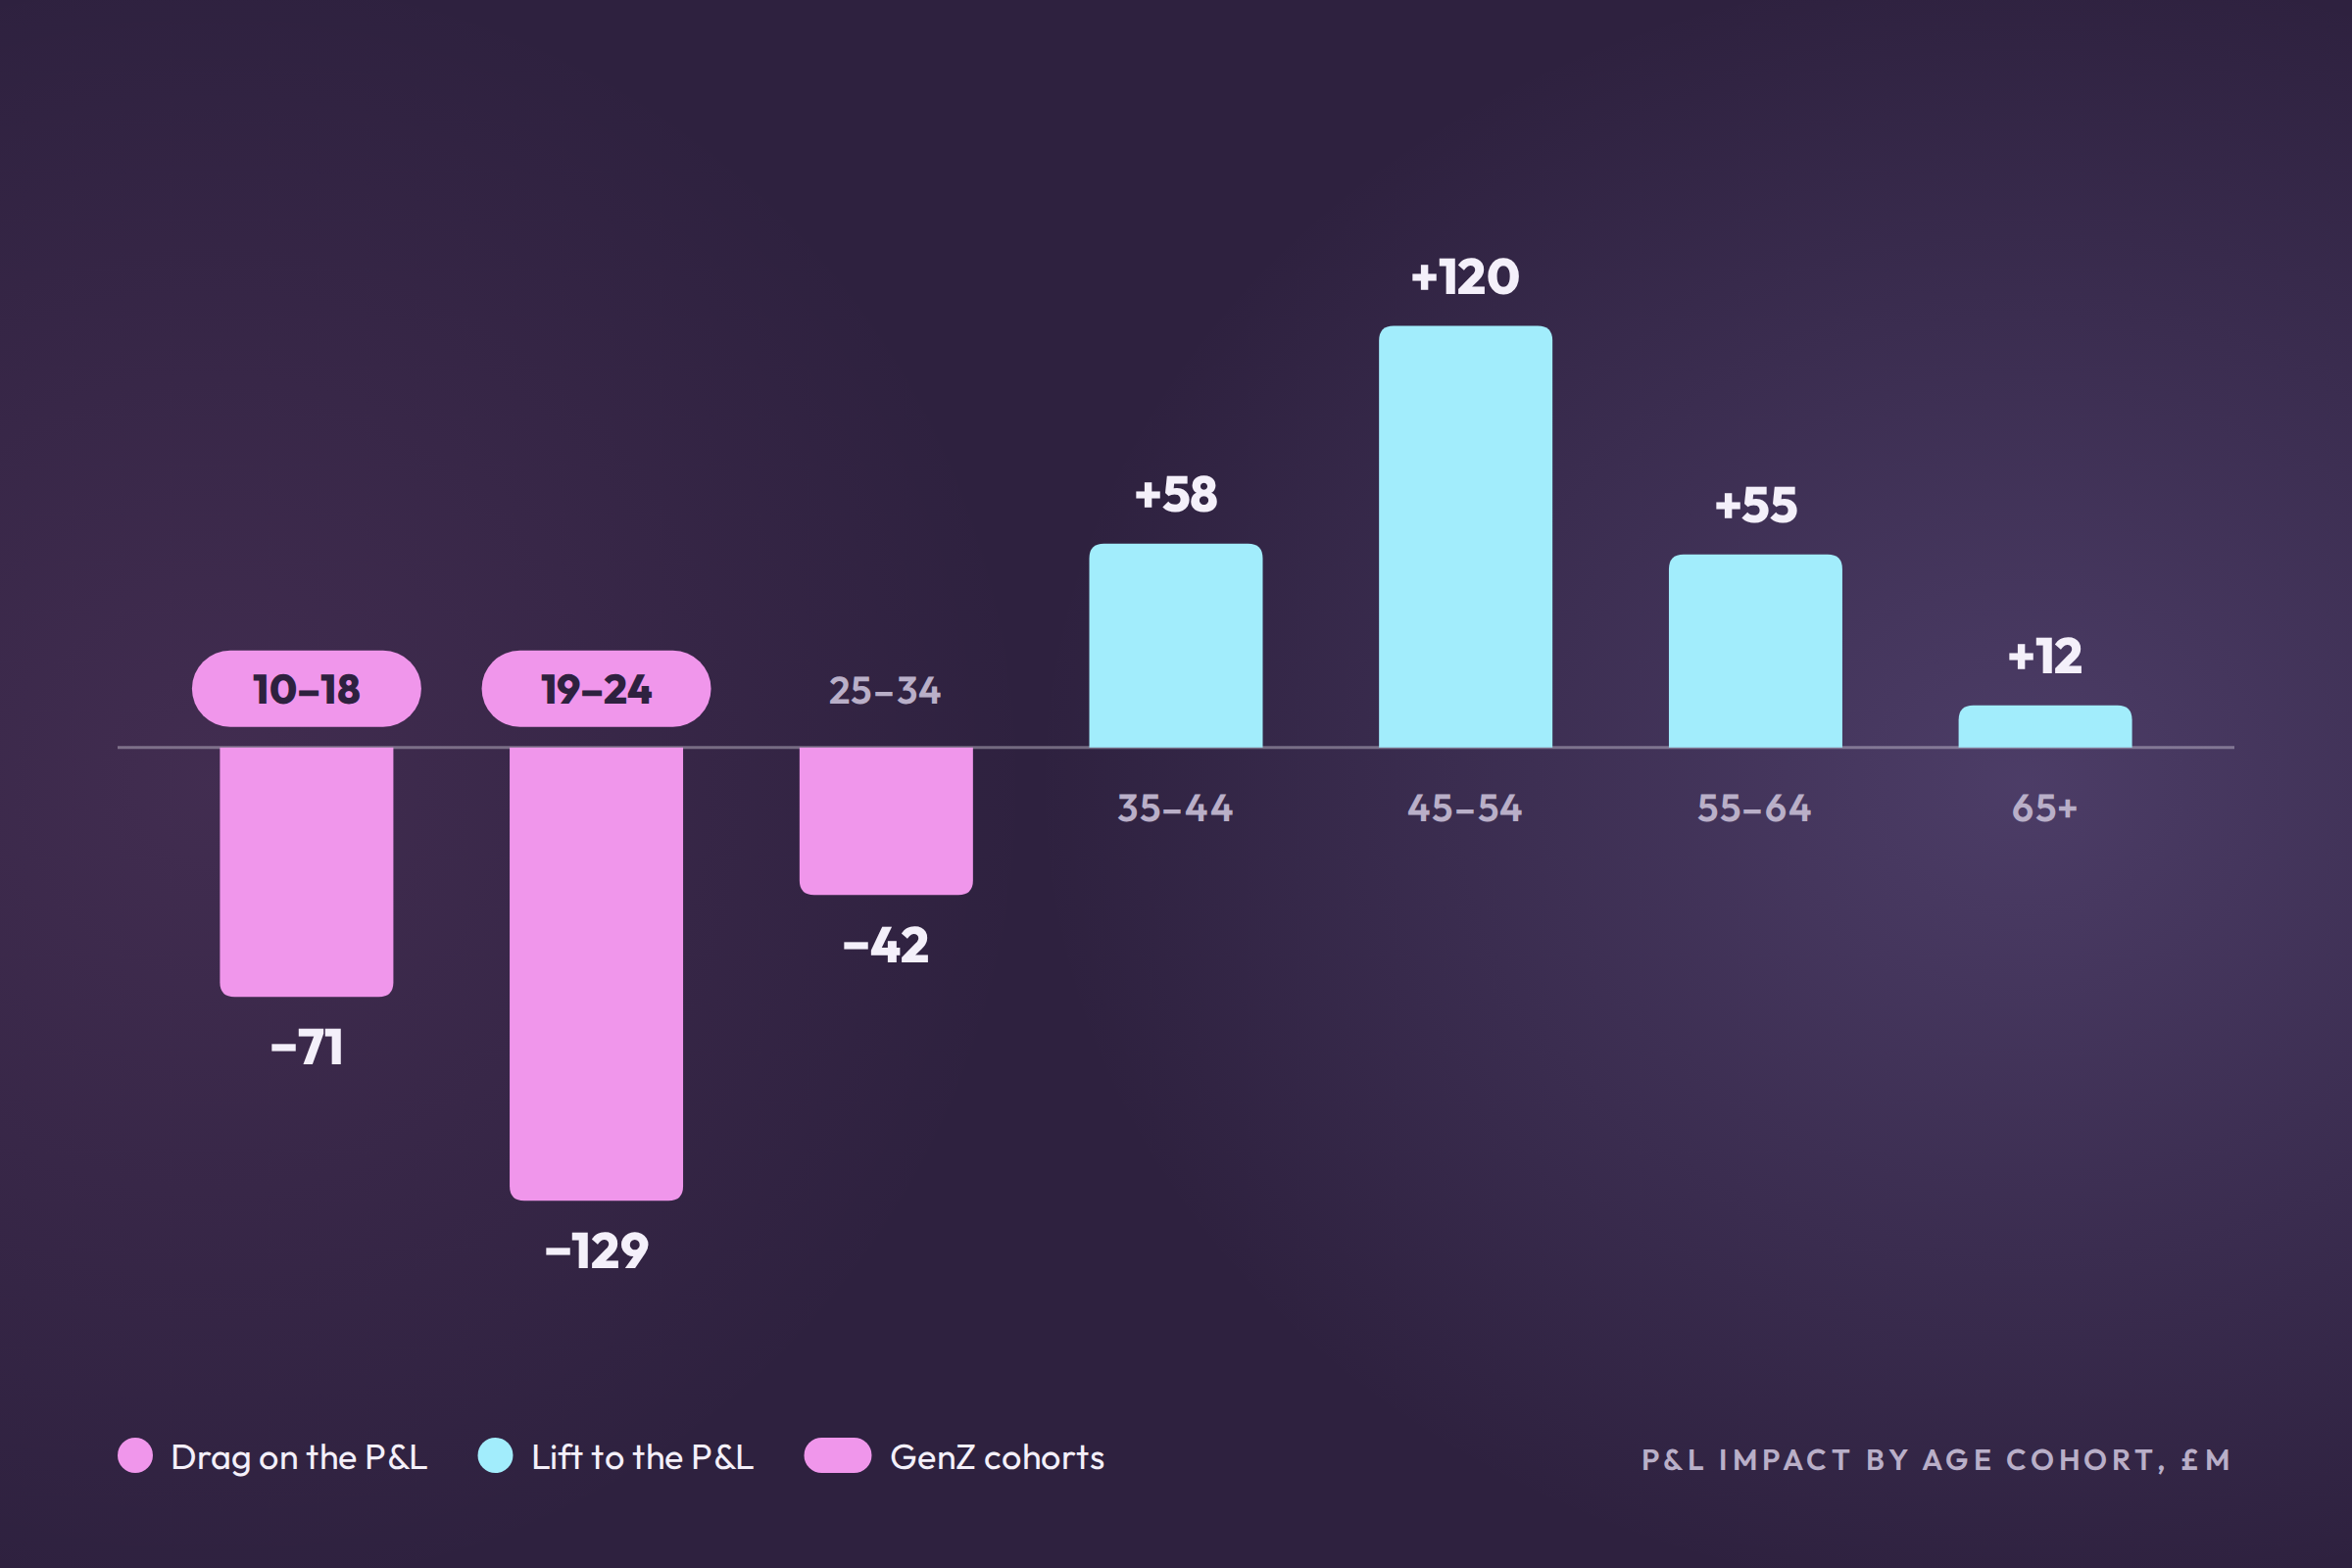
GenZ go-to-market strategy
A premium consumer tech brand was losing ground with GenZ but hadn’t sized the problem. We found a £200m+ drag on the P&L, then built and measured a multi-year GenZ go-to-market that added 1pp of market share and £20m of attributable incremental revenue in year one.